Last night Shane Tucker from CIYD was in college speaking on prophecy at college fellowship.
On his desktop I noticed an amazing graphic see below
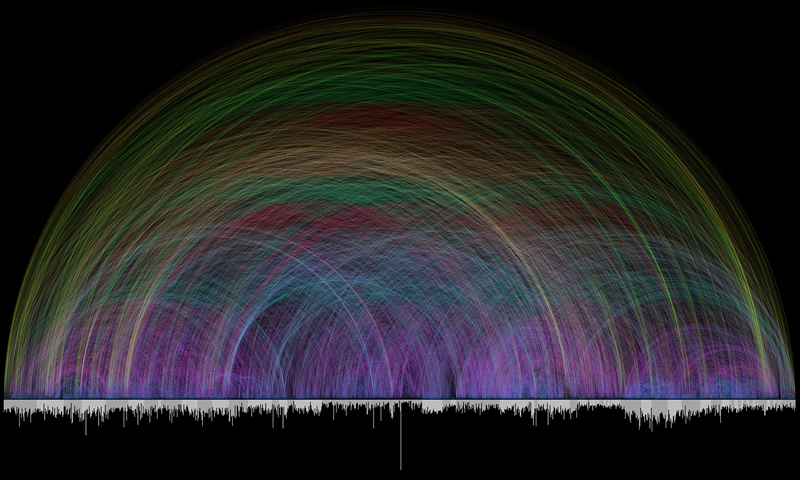
This project was created by chris harrison - the whole can be found here
started after receiving an email from Christoph Römhild. He had compiled a list of cross-references found in the Bible and was looking for advice on how to visualize these connections. After several email exchanges and a copy of Christoph's data, I was able to produce the arc diagram below. Due to the extremely high number of cross-references, this lands more on the aesthetic side of the information visualization spectrum. Different colors are used for various arc lengths, creating a rainbow like effect. The bar graph running along the bottom shows every chapter in the Bible and their respective lengths (in verses). Books alternate in color between white and light gray.
No comments:
Post a Comment